Start from a real target
Paste a URL, scan its public posture, then save the useful signals into a monitored dashboard.
URL to status dashboard
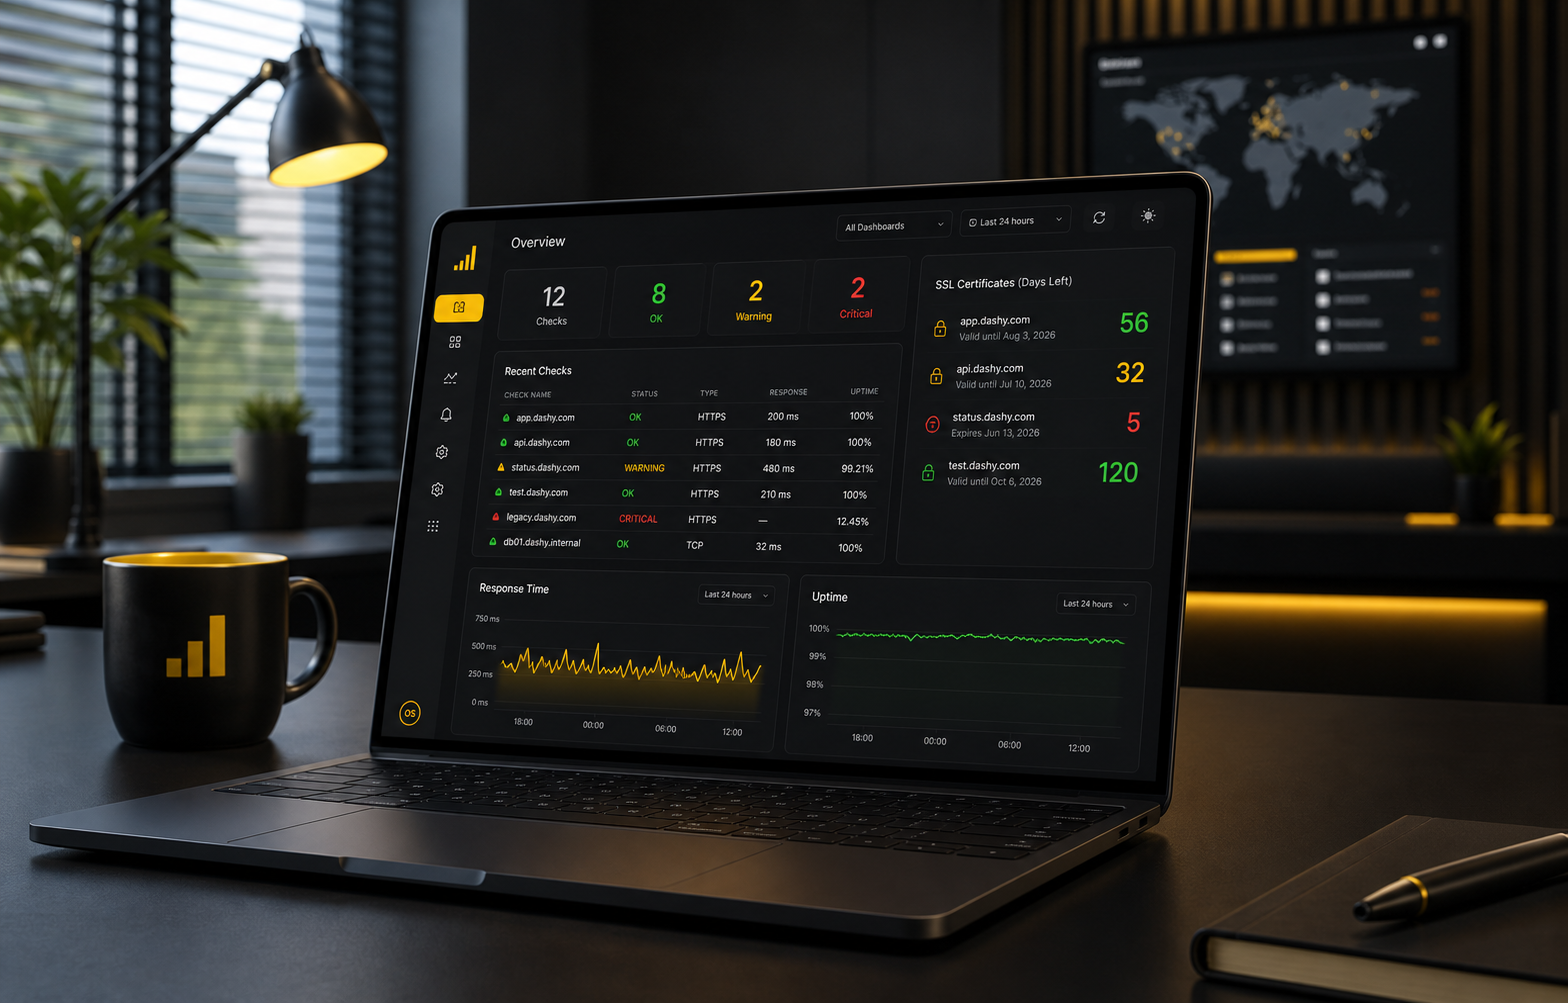
Build a clean public status dashboard from the checks operators already care about: uptime, pages, redirects, DNS, certificates, and third-party dependencies.
Run the scan, choose the checks worth keeping, then sign in to keep history, alerts, and display layouts.
Paste a URL, scan its public posture, then save the useful signals into a monitored dashboard.
Show the specific checks behind each status instead of hiding outages behind a single vague badge.
Use Dashy-hosted pages, password-protected dashboards, or a custom domain when the board is customer-facing.
Component coverage
Quick start creates the first scheduled set, then the component catalog lets teams add DNS, email, redirect, content, JSON, dependency, Search Console, and GA4 monitors.
Built for short operational bursts
Dashy keeps the workflow direct for founders, support teams, agencies, and developers who need a dependable status surface without adopting a heavy observability suite.
Signals
Dashy is intentionally narrower than a general analytics dashboard. It focuses on external service health, website posture, and the checks that explain whether a public service is usable.
Dashboard outputs
Give customers and teammates a clean view of current service health. See status pages.
Review operational status with teammates without exposing internal checks publicly.
Track expiry, records, nameservers, email DNS, CAA, and DNSSEC. See domain monitoring.
Put status on a wallboard, kiosk screen, or browser display for quick scanning. See display boards.
Place read-only VM runtime and cloud cost signals beside website, API, and status checks. See Azure monitoring.
Use Business-plan checks for checkout, login, booking, and other revenue-critical journeys. See transaction monitoring.
Ready to check a service?
Start with quick start, inspect the target, then save the signals worth monitoring.